Issue 33: External Trade – Q3 2014

|
External Trade – Q3 2014
Issue #33 / 28.11.2014
|
||
|
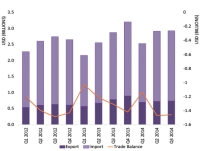
In the Q3 2014, the trade turnover increased (1.9%), compared to the same period in 2013, which is due to the increase of import (4.9%). In this period the volume of exports decreased (-6.2%), due to the decrease of the volume of re-export, therefore the trade balance also worsened (-11.5%).
The top five largest trade partners are still: Turkey (16.7%), Azerbaijan (10.1%), China (8.0%), Russia (7.5%) and Ukraine (5.5%).
|
||
| Share of Export and Import in the Total Trade Turnover | ||

|
During the first three quarters of 2014, the external trade turnover increased (10.4%). The share of import in the total external trade turnover increased (0.9 % point) and the share of export in it decreased correspondingly (-0.9 % point). In this period the trade balance worsened (-14.5%), due to the fact that the volume of import increased more (11.7%) than the volume of export did (6.7%).
In the 3Q 2014, the trade turnover increased (1.9%). The share of import in the total external trade turnover increased (2.2% point) and the share of export in it decreased (-2.2 % point). In this period the trade balance worsened (-11.5%), due to the fact that the volume of import increased (4.9%; 102.9 mln. USD) and the volume of export decreased (-6.2%; -48.1 mln. USD).
Indeed, in III quarter, GEL lost its value against USD by 4.9% (-0.03GEL) and against EUR by 5.04% (-0.023GEL), compared to the same period in 2013. It’s alarming, because devaluation of national currency may create higher inflation. In October 2014, annual inflation rate was 3.4%, compared to October 2013. The largest increase in price level was on vegetables (35.6%).
|
|
| Source: GeoStat | ||
| Import by Commodity Groups | Export by Commodity Groups | |
|
Source: GeoStat
|
Source: Geostat
|
|
|
In the 3Q 2014, the top five imported commodities included petroleum (12.7%), motor cars (9.1%), medicaments (3.7%), gases (2.6%), as well as wheat and meslin (2.5%).
In the 3Q 2014, the volume of import increased (4.9%), compared to the corresponding period in 2013.
Among them, the import of medicament increased significantly (21.8%). The medicaments were mainly imported from Turkey, France, Germany, Hungary and Austria and almost 1/3 of them were re-exported to Azerbaijan, Uzbekistan, Russia, Lithuania, Armenia ( August 2014).
The import of motor cars also increased (13.8%). They were mostly imported from Japan, USA, Germany and their largest share (79%, August 2014) were re- exported to Azerbaijan, Armenia, Russia, Belgium, Turkey and since August 2014, to the United Arabian Emirates too.
The Import of petroleum (+0.6%) as well as import of gases (+9.6%) also increased. This product is mostly imported from Azerbaijan.
The import of wheat and meslin has sharply dropped (-20.8%). In the 3Q 2014, this product was imported only from Russian, while in the corresponding period of 2013, the wheat and meslin was imported from Kazakhstan and Ukraine too.
|
In 3Q2014, the top five exported products included motor cars (16.3%), nuts (10.8%), copper ores (8.6%), ferroalloys (8.0%), and wine (6.2%).
In the 3Q 2014, the volume of export declined (-6.2%), compared to the corresponding period in 2013.
Among them, the export of motor cars sharply decreased (-38.4%) mainly due to the restriction of import of used motor cars in Azerbaijan. In April 2014, Azerbaijan adopted the Euro-4 environmental standard, which restricts the import of cars manufactured in EU before 2005, in the U.S. before 2004 and in Japan before 2011. These categories make a large part of the cars exported from Georgia to Azerbaijan.
The export of nuts significantly increased (41.3%). This is due to increase of volume as well as increase of price of nuts. The largest share of nuts are exports to Germany and Italy, as well as to the other EU countries.
The export of cooper ores ( 34.9%), which is exported mainly to China and the export of ferroalloys (9.1%), which is exported to USA also increased.
The export of wine also increased (12.4%). It is mainly exported to Russia, Ukraine and Kazakhstan.
|
|
| Top Five Partner Countries by Import | Top Five Parner Countries by Export | |

|

|
|
| Source: GeoStat | Source: GeoStat | |
|
In 3Q 2014, the top five partner countries by import included Turkey (19.5%), China (9.1%), Azerbaijan(7.3%), Russia(6.4%), and Ukraine(6.0%).
In the 3Q 2014, the import from Turkey significantly increased (29.0%) compared to the same period in 2013, which was mainly due to the growth of imported medicaments and small containers.
The imports from China also jumped up (41.0%). The commodities imported from China include electronic devices and other automatic equipments, as well as their components.
The import from Azerbaijan increased slightly (0.6%) in this period. The commodities imported from Azerbaijan are petroleum and gas.
The imports from Russia (-13.6%), as well as from Ukraine (-20.4%) dropped down. The commodities imported from Russia were mainly wheat and meslin, food oil, as well as petroleum oil and from Ukraine – cigarettes and iron & steel.
|
In the 3Q 2014, the top five partner countries by export included Azerbaijan (18.5%), Russia (10.6%), Armenia (9.3%), Turkey (8.3%), and also USA (6.1%). USA is among the top five partner countries by export since 3Q 2014.
The export to Russia has increased (26.5%), compared to the 3Q 2013. The main commodities exported to Russia were wine, mineral water, motor cars, ferroalloys and beverages.
The export to Turkey (12.3%) also increased. In this period, the main commodities exported to Turkey included fertilizers, greaves, electricity, iron & steel.
The export to USA also increased (33.6%). This basically included air and vacuum pumps and also ferroalloys.
The exports to Azerbaijan significantly declined (-30.8%) due to the ban of import of used motor cars. Besides motor cars, export to Azerbaijan also included iron & steel, medicaments and live animals.
Export to Armenia has also decreased (-16.5%). Motor cars and tracks, iron & steel, wheat and meslin, and oil-cake were top export products.
|
|
|
|
||

|
||


