Issue 88: External Trade – 2016

|
External Trade – 2016
Issue #88/ 31.01.2017
|
||
|
In 2016, compared to 2015:
• The volume of imports
|
||
|
Source: National Statistics Office of Georgia
|
|
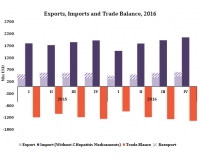
In 2016, compared to the indicator for the corresponding period in 2015, the volume of registered trade of goods decreased by 1.4% and amounted to 9 357 mln USD. In this period, the volume of imports* (-0.5%) as well as the volume of exports (-4.1%) decreased. Therefore, the trade balance deteriorated (-1.1%). In 2016, the most exported
|
|
It should be noted that the rate of re-export among several of the most exported commodities is high. For instance, 95% of exported cars are re-exported (159 mln USD). The proportion of re-exports within exported medicaments is 74% (79 mln USD) and for spirits the share is 56% (52 mln USD). In 2016, compared to 2015, there has been growth in the export of
|
||
|
|
|
|
|
In 2016, the breakdown of exports Among the top eight trade partner countries, re-export amounts to 20.7% of total exports In 2016, the share of re-export in total exports is 21.6%. The volume of re-exports is 19.6% lower compared to the corresponding indicator in 2015. The breakdown of re-exports is as follows: cars (35% of total re-export), spirits (11%), tyres (4%) and cigars (2%). It should be noted that the re-export of medicaments decreased significantly (– 30.7%) and there was also a decrease in the re-export of cars (-7.5%).
|
||
|
Source: National Statistics Office of Georgia
National bank of Georgia
|
Source: National Statistics Office of Georgia
National bank of Georgia
|
|
|
In 2016, compared to 2015, the volume of imports decreased by 0.5% and amounted to 7.2 bln USD. The most imported commodities are: oil (8.5% of total imports, 619 mln USD), cars (6.5% of total imports, 475 mln USD), gases (4.4% of total imports, 318 mln USD), medicaments (3.8% of total imports, 272 mln USD) and copper ores (3.4% of total imports, 207.9 mln USD). In 2016, compared to 2015, the import of gases decreased significantly (-23.6%) as did the import of the following products: medicaments (-7.0%), oil (-6.1%) and cigarettes (-1.7%). In this period, the import of metal construction increased (52.9%), copper ores ( 19.6%), telephones (18.3%) and cars (1.1%). Excluding the import of hepatitis C medicaments as a gift from Ireland and Canada**, the largest trade partner in terms of imports is still Turkey (18.7% of total imports). The second largest trade partner in terms of imports is Russia (9.3% of total imports, 675 mln USD). In 2016, compared to 2015, the imports from Russia increased by 8%. The import of gases and petroleum products has increased significantly (46.9%) while the import of wheat decreased (25%). In 2016, compared to 2015, imports from the Netherlands (69.3%) and from Italy (33.0%) increased significantly. From the Netherlands and Italy it is mostly taps and pipes that are imported (13.3% of imports from the Netherlands; 9.2% of imports from Italy). In this period, imports decreased from Ukraine (-8.4%), from Azerbaijan (-8.1%), from China (-6.8%) and from Germany (-2.8%). From Ukraine, the most imported product was cigars (12.0% of imports from Ukraine), from Azerbaijan it was oil and petroleum (19.3% of imports from Azerbaijan), from China it was flat metal (3.8% of imports from China) and from Germany it was cars (18.7% of imports from Germany).
** In 2016, if we include the import of hepatitis C medicaments, Canada is the largest trade partner in terms of imports (18.2% of total imports) Similar to Canada, the share of Ireland in total imports increased significantly and amounted to 8.6% which is due to the import of hepatitis C medicaments.
|
||
|
Source: National Statistics Office of Georgia Forecast*
|
||

 Source: National Statistics Office of Georgia
 Source: National Statistics Office of Georgia

