Issue 91: Foreign Direct Investments, 2016


|
Foreign Direct Investments, 2016
Issue #91/ 29.03.2017
|
||
|
Based on the preliminary data, in 2016 compared to 2015:
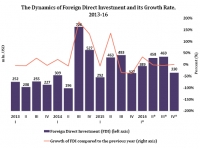
• The volume of foreign direct investment (FDI) increased by 5% and amounted to 1.6 bln. USD.
|
||
|
Source: National Statistics Office of Georgia
|
|
Source: National Statistics Office of Georgia
|
|
In 2016, the volume of FDI in Georgia reached 1.6 bln. USD which is 5% higher than the corresponding indicator in 2015. There was growth in investment in the first quarter (33.4%; 97.4 mln. USD) and the fourth quarter (1.0%; 3.2 mln. USD). In the second and the third quarters the volume of FDI reduced by 1.1% (5.0 mln. USD) and 3.0% (14.7 mln. USD) respectively.
In 2016, the top five investors by country were Azerbaijan (35.2% of the total investment; 578 mln. USD), Turkey (16.6%; 272 mln. USD), United Kingdom (7.3%; 120 mln. USD), Netherlands (5.8%; 95 mln. USD) and Czech Republic (5.7%; 93 mln. USD). Compared to 2015, there was significant growth in investment from Turkey (275%; 199 mln. USD), Czech Republic (458%; 76 mln. USD), US (144%; 26 mln. USD) and Azerbaijan (5.2%; 28 mln. USD). Meanwhile, the volume of investment decreased from United Kingdom (68.7%; 265 mln. USD), Netherlands (38.6%; 60 mln. USD) and Luxembourg (25.8%; 27 mln. USD).
|
||
|
|
|
|
|
Since 2013, the volume of FDI from Azerbaijan has been increasing year-on-year.. The largest growth here was recorded in 2014 when the volume of investment increased by four times, compared to the previous year. Before 2016, the volume of FDI was characterized by low volatility but in 2016 the volume of investment increased significantly (4 times).
It should be noted that in 2016, compared to 2015, from China and Russia, the largest trade partner countries for Georgia, the volume of FDI decreased by 59.1% (39 mln. USD) and 51.4% (23 mln. USD) respectively. The largest investments from China and Russia were recorded in 2014, while in 2015-16 the volume of FDI showed a decreasing trend.
|
||
|
Source: National Statistics Office of Georgia
|
|
|
|
In 2016, the breakdown of FDI by industry differed from the corresponding structure in 2015. Health-care, hotels and restaurants are not among the top five receiving industries of FDI. These sectors were overtaken by construction and manufacturing.
In 2016, compared to 2015, the volume of FDI in manufacturing (79%; 53 mln. USD), energy (64%; 79 mln. USD), construction (48%; 53 mln. USD) and transport and communication (10%; 60 mln. USD) increased significantly. At the same time, the volume of FDI decreased in the financial industry (-24%; 43 mln. USD). It should be noted that the volume of FDI in transport and communication has been increasing since 2013. On the other hand, the volume of FDI in the energy industry again increased after a reduction in the 2014-15 period.
|
||
|
Source: National Statistics Office of Georgia
|
Source: National Statistics Office of Georgia
|
|
|
In 2016, the largest share of FDI is still sent to Tbilisi (78%; 1.2 bln. USD). In the mentioned period, the volume of FDI to Tbilisi increased (3%; 41 mln. USD). Other attractive regions for foreign investors were Adjara (10% of the total investment), Kvemo Kartli (5%), and Samegrelo-Zemo Svaneti and Guria (3%). The least popular is Shida Kartli (0.04%).
In 2016, the volume of FDI increased in the following regions: Kvemo Kartli (265%; 56 mln. USD), Samtskhe-Javakheti (79%; 22 mln. USD), Shida Kartli (16 mln. USD), Samegrelo-Zemo Svaneti, Guria (6%; 2 mln. USD) and Imereti (3%; 0.9 mln. USD). The volume of FDI decreased in Kakheti (-94%; 15 mln. USD) and Adjara (-21%; 43 mln. USD).
Since 2013, in Adjara the volume of FDI saw an increase but in 2016 the volume of investment decreased. On the other hand, in Kvemo Kartli the volume of FDI was characterized by high volatility, but in 2016 the volume of investment in Kvemo Kartli increased.
|
||
|
Source: National Statistics Office of Georgia
|
||


