Issue 41: Energy Sector – 2014


|
Energy Sector – 2014
Issue #41 / 10.03.2015
|
||
|
In 2014, both the volume of the internal generation (2.9%; 292.9 mln.kvt.hr) as well as consumption of power (5.1%; 507 mln.kvt.hr) increased compared to 2013. In the mentioned period, the power consumption exceeds the power generation, hence, the negative balance was satisfied by the import of electricity (793.2 mln.kvt.hr).
In 2014, the value added in energy sector increased (5.2%) compared to 2013.
In the first three quarters of 2014, the volume of investments in energy sector declined (-52.9%) compared to corresponding period in 2013.
|
||
| Electricity Balance, 2013-15 | Avarage Weighted Price of Balancing Power, 2013-15 | |
|
Source: Esco
|
Source: Esco
|
|
|
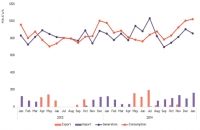
In January 2015, the electricity generation is lower (166 mln.kvt.hr) compared to consumption in the country. In this period, negative balance of energy consumption was eliminated by the import of electricity (51.2 mln.kvt.hr).
In January 2015, the growth of power consumption (4.4%; 43 mln.kvt.hr) exceeds the growth of power generation (0.3%, 2.69 mln.kvt.hr) compared to January 2014. Accordingly, electricity import increased (32.1%; 40.369 mln.kvt.hr) in this period.
The balance of electricity consumption and generation is negative (-248.3 mln.kvt.hr) also in 2014. It should be noted, that negative balance increased (213 mln.kvt.hr) also in comparison with the indicator of 2013 (33.7 mln.kvt.hr).
In 2014, the indicator of electricity import in Georgia is 793.2 mln.kvt.hr. , which exceeds (63.8%; 309.1 mln.kvt.hr) the corresponding indicator in 2013. Electricity import is increasing in the period of autumn and winter.
Despite the negative balance of power, Georgia is also electricity exporter. In 2014, the indicator of the electricity export is 545.0 mln.kvt.hr. Georgia exports electricity basically in spring and autumn.
The average weighted price of balancing power (20% of total power) is characterized by seasonality, but this is not depicted on the price the consumers pay. This indicator increase in the period of July-January and decreases in the period of February-June. In January 2015, this indicator achieved its highest level (13 tetri) during the last two years, which is due to GEL depreciation and increase of price of the electricity imported from Russia.
|
||
| Electricity Generation by the Thermal and Hydro Power Plants, 2011-14 | Electricity Consumption, 2011-14 | |
|
Source: Esco
|
Source: Esco
|
|
|
In 2014, the volume of power generated in Georgia is 10 153.6 mln.kvt.hr. Among them, 81 % (8 221 mln.kvt.hr) is generated by the hydro and 19% (1 932.5 mln.kvt.hr) is generated by the thermal power plants.
In 2014, the volume of the power generated by the hydro power plants increased (0.7%; 57.7 mln.kvt.hr) compared to 2013, but its share in the total power generation declined (1.8 percent point).
In 2014, the volume of the power generated by the thermal power plants also increased (13.9%; 235.4mln.kvt.hr).
|
In 2014, the indicator of power consumption is 10 170 mln.kvt.hr. Among them, 68.5% is consumed by the distribution companies, 15.4% by the direct customers (Georgian Water and Power; Georgian Railway; Georgian Manganese; Rustavi Water; Geoferrometal) and 16.1% by Abkhazia.
In 2014, power consumption by the distribution companies (6.8%; 442.3 mln.kvt.hr) as well as the direct consumers (0.3%; 4.3 mln.kvt.hr) and Abkhazia (2.1%; 33.4 mln.kvt.hr) increased compared to 2013.
|
|
|
|
||
| Electricity Export by Countries, 2007-2014 | Electricity Import by Countries, 2007-2014 | |
|
Source: Esco
|
Source: Esco
|
|
|
In 2014, the indicator of the total electricity exports (Direct investment + Transit) is 545 mln.kvh. The destination of 26.5 % of total export is Russia, 1.3% is Azerbaijan and 48.9 % is Turkey. 9.7% of total export is transit.
In 2014, the volume of electricity export to Russia declined significantly (-56.8%; -210.6mln.kvt.hr), but the export to Armenia (91.9%; 67.2 mln.kvt.hr), in Azerbaijan (21.0%; 1.4 mln.kvt.hr) and Turkey (290.0 mln.kvt.hr (236.5 mln.kvt.hr – direct export, 58.5 mln.kvt.hr – re-export)) increased.
In 2014, the indicator of the total electricity import (Import + Transit) is 793.3 mln.kvt.hr. Among them, 73.7 % of import is from Russia (71.4% -direct, 2.3% – transit), 21.6% is from Azerbaijan and 4.5 % is from Armenia (transit).
In 2014, the import from Russia (36.4%, 167.7 mln.kvt.hr) as well as the import from Azerbaijan (7 times; 160.6 mln.kvt.hr) increased.
|
||
| Value Added in Energy Sector and its share in GDP, 2007-2014 | FDI in Energy Sector, 2007-2014 | |
|
Source: Esco
|
Source: Esco
|
|
|
In 2014, the indicator (forecast) of value added in energy sector increased (5.2%; 36.7 mln. GEL) compared to 2013 and achieved 736.5 mln.GEL. The share of this indicator in GDP is still 3%.
In the first three quarters of 2014, the foreign direct investment in the energy sector is 92.9 mln. USD, which is significantly lower (-52.9%; -104.1 mln. USD) compared to the corresponding indicator in 2013. In this period, the share of FDI in the energy sector in total FDI is 10.0 %.
|
||
|
|
||
 |
||


