Issue 19: External Trade – 2013


|
External Trade – 2013
ISSUE #18 / 11.02.2014
|
|||
|
In 2013 the negative external trade balance decreased (-9.1%, -500 mln. USD) compared to the corresponding indicator in 2012. In the mentioned period, the volume of export increased significantly (22.4%, 532 mln. USD), while the volume of import almost remained unchanged (0.4%, 32 mln. USD).
In 2013, the external trade turnover with EU countries increased (3.5%, 97.8 mln. USD). It is notable, that export to EU countries increased (72.2%, 255 mln.USD), but the volume of import from EU countries decreased (-6.4%, -156 mln. USD).
In 2013, the volume of the following exported products : copper ores (202%, 108 mln.USD), motor cars (20%, 116 mln.USD), nuts (99%, 83 mln.USD), wines (97%, 63 mln.USD) and mineral waters (80%, 47 mln.USD) increased considerably, while the volume of the following exported products: Ferro-alloy (-12%, -30mln.USD), Ferrous waste and scrap (-85%, -37 mln.USD) and mixed goods (-87%, 32 mln.USD) reduced.
Turkey still remains the major trade partner for Georgia. Its contribution in total trade turnover is 14.2%.
|
|||
|
|
|
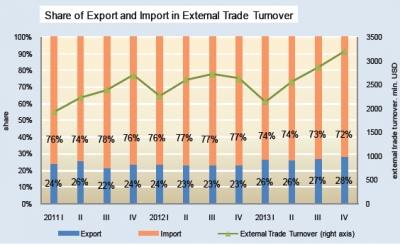
In 2013, external trade turnover was 10.8 billion USD, which ex-ceeds the corresponding indicator of 2012 (5.5%), as well as the indicator of 2011 (16.6%).
In 2013, the share of export in external trade turnover increased (27%), and the share of import in external trade turnover de-creased (73%) in comparison with the corresponding indicators in 2012 (23.3%, 76.7%).
|
|
|
|
|||
|
In 2013, the volume of export as well as the volume of import increased (22.4%, 0.4%). In the mentioned period, real GDP also increased (3.1%)1.
In 2013, the share of export to GDP increased (18%), but the share of import to GDP decreased (48.7%), in comparison with the cor-responding indicators of 2012 (15%, 49.5%).
In 2013, external trade balance to GDP is -30.7%, while this indi-cator was -34.% in 2012.
1. Forecast of GDP growth by GEOSTAT, based on the VAT payer enter-prises turnover, fiscal and monetary indicators.
|
|||
|
|
|||
|
|
|||
|
|
|
In the fourth quarter of 2013, the volume of import, as well as the volume of export increased in comparison with the fourth quarter of 2012 (14%, 291 mln.USD; 46%, 282 mln.USD). This indicates the recovery process of economy. | |
 |
|
|
|
|
In 2013, top five trading partner countries by export were: Azerbaijan (24%), Armenia (11%), Ukraine (7%), Russia (7%) and Turkey (6%). The contribution of EU countries in total export is 21%, which is significantly higher (6.1 percentage point) compared to the corresponding indi-cators in 2012 (14.8%). In the mentioned period, the volume of export to EU countries increased dramatically (72.2%, 255 mln.USD).
In 2013, five major exported commodities were: motor cars (24%), ferro-alloys (8%), nuts (6%), copper ores (4%), fertilizers (4%). Based on the fact that cars are not locally produced and are just re-exported through Georgia, Ferro-Alloys can be considered as the major exported commodity in 2013.
In 2013, the volume of the following exported products increased considerably : copper ores (202%, 108 mln.USD), motor cars (20%, 116 mln. USD), nuts (99%, 83 mln.USD), wines (97%, 63 mln.USD) and mineral waters (80%, 47 mln.USD).
|
|||
 |
|||
|
|
|||
|
In 2013, the top five trading partner countries by import were: Turkey (17%), China (8%), Azerbaijan (8%), Ukraine (8%), Russia (7%) and China (7%). The major commodities imported from Turkey were: medicaments (52 mln.USD), Structures and parts of structures of iron or steel (36 mln.USD) and sanitary and hygienic products (33 mln.USD). The major commodities imported from Azerbaijan were: petrol and petroleum (276 mln. USD) and gases (247 mln.USD). The major commodities imported from Ukraine were : cigarettes (74 mln.USD) and fittings (44 mln.USD).
Five major imported commodities were: petroleum (14%), motor cars (10%), gases (4%), medicaments (4%) and wheat (3%). The contribution of imported product from EU countries in total import is 29%.
|
|||
 |
|||
 |
|||


