100: Georgian Economy – Overview, 2007-2017

|
Georgian Economy – Overview, 2007-2017
Issue #100/ 16.01.2018
|
||
|
The 100th edition of Economic Outlook and Indicators happily coincides with PMCG’s 10-year anniversary. Through the last decade, Georgia’s economic indicators have fluctuated substantially. In this edition, we present the dynamics of development for this period, and also analyze the main economic indicators for 2007-2017.
|
||
|
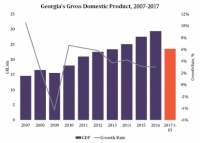
Gross Domestic Product
|
||
|
Source: Georgian National Statistics Office
|
Throughout the past decade, Georgia’s gross domestic product (GDP) increased by an average of 4.2% annually. There have been no significant changes in the structure of Georgian GDP in the last 10 years. However, some differences are worth noting when comparing the GDP structure of the first three quarters of 2007, and the corresponding period of 2017. In the first three quarters of 2007, agriculture contributed 11.2% of total GDP which dropped to 8.7% in the corresponding period of 2017.
|
Source: Georgian National Statistics Office
|
|
From a broader perspective, in 2016 agriculture contributed a mere 1.5%1 of EU Member States’ combined GDP. The increased share of the construction sector in Georgia’s GDP is also noteworthy. In the first three quarters of 2007, construction contributed 7.8% of total GDP, while in the corresponding period of 2017 this reached 9.4%. The decreased share of public administration in GDP (from 13.7% to 7.6%) is noteworthy but needs further research.
|
||
|
Consumer Price Index
|
||
|
Source: Georgian National Statistics Office
|
Across the last decade, consumer prices in Georgia increased by an average of 4.6% annually. In the given period, consumer prices decreased only twice, in 2012 and 2013. After 2013 the consumer prices started increasing once again. In December 2017, compared to December 2007 prices increased by 44.8%. In the given period, the prices of alcoholic beverages and tobacco (90.4%) and healthcare (78.0%) increased the most. Decreases in prices over this period were visible in only clothing and footwear (32.0%) and communications (6.8%). In the five biggest Georgian cities (according to population) prices increased the most in Kutaisi (52.1%) and they increased the least in Gori (36.8%).
|
|
| Georgian Lari Exchange Rate |
||
|
|
In 2017, compared to 2007, the Georgian Lari depreciated against the US Dollar by 50% and by 24% against the Euro. The year of 2015 is particularly noteworthy as in this year alone the national currency depreciated against the US Dollar by 29%. When it comes to exchange rates with neighboring countries, the general picture is somewhat different. In 2017, compared to 2007, Georgian Lari has appreciated by 46% against the Turkish Lira and by 25% against the Azerbaijani Manat. The Azerbaijani Manat’s depreciation against the Georgian Lari was particularly severe in 2016 (34%). Until 2016, the Manat-Lari exchange rate was characterized by stability. Compared to 2007, in 2017 the Georgian Lari also appreciated against the Armenian Dram (6%). The Russian Ruble has also depreciated against the Georgian Lari by 34% in 2017 compared to 2007. The exchange rate between the Georgian Lari and the Russian Ruble is characterized by stability compared to other discussed currencies when comparing yearly averages. Since 2014, 1 Russian Ruble has been equivalent to 0.04 Georgian Lari.
|
|
|
Foreign Trade
|
||
|
|
From 2007 onwards, the dynamics of external trade has been unsteady. In the past 10 years, Georgian exports peaked in 2013 (USD 2.9 bln) when the Russian market re-opened for Georgia and the national currency depreciated. The peak for Georgian imports for this period, on the other hand, was recorded in 2014 (USD 8.6 bln). The composition of Georgia’s main export partners in 2017 has changed significantly since 2007. The top five export destinations in the first three quarters of 2007 were Turkey (15% of total exports), Azerbaijan (11%), Armenia (9%), the USA (9%), and Ukraine (7%). A decade later, in the first three quarters of 2017 its main export destinations were the Russian Federation (14%), Azerbaijan (8.6%), Turkey (8.5%), China (8.3%), and Armenia (7.6%). In the first three quarters of 2007, the Russian Federation was in 7th place for this indicator with only 4% of total exports. This can be explained by the embargo imposed by the Russian government on Georgian products in 2006. After the embargo was lifted in 2013, the Russian Federation soon returned as Georgia’s top export destination.
|
|
| Meanwhile, in the first three quarters of 2017 only three countries appear in the top 10 export partners that were not listed in the corresponding period of 2007. Canada (5.1% of total exports), Germany (4%), and Turkmenistan (2.9%) were replaced by China (8.3% of total exports), Iran (3%), and Switzerland (2.7%). | ||
|
|
Compared to the first three quarters of 2007, Georgian exports to the EU have increased 2.3-fold in the corresponding period of 2017. In the first three quarters of 2007, exports to the EU amounted to USD 198 mln, which was 23.0% of total exports. A decade later, and exports to the EU amounted to USD 462 mln in the first three quarters of 2017, which is 23.8% of total exports. In terms of which actual products are being exported, ‘copper ores’, ‘ferro-alloys’, and ‘motor cars’ were prominent in the first three quarters of both 2007 and 2017.
|
|
| Unlike in 2007, the list of most exported products in the first three quarters of 2017 contains wine and medicaments. Georgian wine exports depend heavily on the Russian market. Georgia’s main importing partners was similar in the first three quarters of both 2007 and 2017. The top importing countries still remain Turkey (17% of total imports) and the Russian Federation (9%). Throughout the last 10 years, the share of products imported from Turkey in total imported products has increased but the Russian Federation’s share has decreased. However, the import volume has increased from both countries, amounting to USD 952 mln and USD 532 mln respectively. Regarding China, throughout the past 10 years its share in total imports to Georgia has been steadily increasing year by year and in the first three quarters of 2017 China became Georgia’s third biggest partner in terms of imports (USD 480 mln). The list of the most imported products has also scarcely changed in the past 10 years. The top two imported products are ‘petroleum and petroleum oils’ and ‘motor cars’. The only difference of note is that in the first three quarters of 2017 ‘copper ores’ was listed as one of the most imported products. ‘Copper ores’ imports have been increasing since 2011.
|
||
|
|
It is important to note that ‘motor cars’ and ‘copper ores’ appear in the lists of both the most imported products and the most exported products. In the first three quarters of 2017, Georgia exported ‘copper ores’ worth USD 309 mln and ‘motor cars’ worth USD 149 mln. At the same time, Georgia imported ‘copper ores’ worth USD 258 mln and ‘motor cars’ worth USD 343 mln. The export of ‘copper ores’ and ‘motor cars’ could mostly be classified as re-exports. ‘Copper ores’ are mostly imported from Armenia and then re-exported to Bulgaria and China. ‘Motor cars’ are mostly imported from the USA and Japan and then re-exported to Azerbaijan and Armenia. |
|
| Foreign Direct Investments |
||
|
|
The dynamics of foreign direct investment (FDI) in Georgia in the last 10 years can be summarized as follows: 2007 was the peak (USD 1.8 bln) of the past decade, which was followed by a decrease until 2013 caused by the global financial crisis and the 2008 war. From 2013 onwards, FDI has been stable.
Interestingly, only two countries, Turkey and the Netherlands, were listed in the top 5 countries investing in Georgia in the first three quarters of 2007 as well as in the corresponding period of 2017. Azerbaijan, which is the country to have invested most in Georgia in the first three quarters of 2017, held 19th position in the corresponding period of 2007.
It is also interesting to note that, compared to the first three quarters of 2007, FDI was less diversified in the corresponding period of 2017 in terms of investing countries. In the first three quarters of 2007, the top five investing countries’ share of total FDI was 57.1%, while in the corresponding period of 2017 the same indicator increased significantly and reached 74.1%.
|
|
| Remittances | ||
|
|
In the first three quarters of 2017, remittances to Georgia increased by 166% compared to the corresponding period of 2007. In the past decade, remittances to Georgia peaked in 2013 when it amounted to USD 1.5 bln (10.5% of Georgia’s GDP).
The part of the Russian Federation underwent substantial change over this period in terms of remittances to Georgia. In the first three quarters of 2007, remittances from the Russian Federation amounted to USD 384.5 mln, which was 64.1% of total remittances to Georgia. In the corresponding period of 2017, the same indicator decreased to USD 331.3 mln, which is 33.3% of total remittances to Georgia.
|
|
| Interestingly, remittances to Georgia have become more diversified in the last 10 years. In the first three quarters of 2007, the top five countries in terms of sending remittances made up 87.3% of total remittances, while the same indicator in the first three quarters of 2017 decreased significantly to 72.6%. | ||
| Tax Revenues | ||
|
|
The tax revenues of the first three quarters of 2017 exceed the tax revenues of the corresponding period of 2007 by 169%. Even though after 2007 the number of taxes and their corresponding rates have decreased2 (other than the excise tax), tax revenues have generally increased from 2007 onwards. In the past decade, decreases were registered only twice, in 2009 (7.7%) and 2013 (0.2%), and the highest yearly increase was recorded in 2011 (26.0%).
|
|
|
In the tax revenue structure, the share of value added tax is highest in the first three quarters of both 2007 and 2017. The share of income tax in the total tax revenues increased by 161% which can be explained by the abolition of the social tax and the increase of the income tax rate3. The share of excise tax in total tax revenues increased by 47% and the share of property tax is increased by 57%. The shares of all other taxes in total tax revenues have decreased. The proportion of tax revenues to GDP has been stable at 24-26% since 2007.
|
||
|
Government Debt
|
||
|
|
Since 2007, Georgia’s government debt4 has continuously increased. The highest increase was recorded in 2008, which can be explained by the 2008 war. From 2008 to 2012, the growth rate was decreasing for government debt but from 2013 to 2016 it has again been growing. The proportion of government debt to GDP is often used to evaluate the sustainability of government debt. From 2007 to 2010, this proportion had an increasing tendency (from 25.5% to 42.4%). From 2011, it started to decrease but returned to its increasing tendency in 2014. At the end of the first three quarters of 2017, Georgia’s government debt was GEL 15.9 bln, which is 43% of the GDP of the fourth quarter of 2016 and the first three quarters of 2017 last four quarters combined. The analysis of government debt covers only the government’s and national bank’s debt. However, according to the International Monetary Fund’s recommendation, government debt should also include state-owned enterprises’ debt and, for developing countries, the proportion of public debt to GDP should not exceed 50%5.
|
|
| If we include the state-owned enterprises’ debt in Georgia’s government debt (debts of the government, the national bank, and the state-owned enterprises) the proportion of government debt to GDP in 2015 was 53.3% and in 2016 it reached 58%6, which already exceeds the IMF’s recommended critical threshold. Meanwhile, the Organic Law of Georgia on Economic Freedom sets the relevant threshold at 60%.
The proportion of tax revenues to GDP has been stable at 24-26% since 2007. |
||
 |
||
|
1 http://ec.europa.eu/eurostat/statistics-explained/index.php/National_accounts_and_GDP
|
||
| PMCG Research | Giorgi Khishtovani | [email protected] | +995 32 2 921 171 (103) | http://www.research.pmcg-i.com| |
||


 Table: December 2017 compared to December 2007
 Source: National Bank of Georgia
 Source: Georgian National Statistics Office
 Source: Georgian National Statistics Office
 Source: Georgian National Statistics Office
 Source: Georgian National Statistics Office
 Source: Georgian National Statistics Office
 Source: Georgian National Statistics Office
 Source: National Bank of Georgia
 Source: National Bank of Georgia
 Source: Ministry of Finance of Georgia
 Source: Ministry of Finance of Georgia
 Source: Ministry of Finance of Georgia