Issue 55: State Budget Compliance – January-July, 2015

|
State Budget Compliance – January-July, 2015
Issue #55 / 11.09.2015
|
||
|
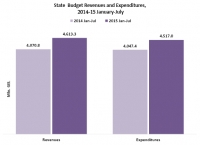
For the period of January-July 2015, the indicator of state budget revenues compliance is 58.0% and the indicator of state budget expenditure compliance is 56.3%. These indicators exceed the corresponding indicators of 2014 by 2.4 % points and 2.6 % points respectively.
In this period, the largest source of state budget revenue is still tax revenues (93.5%) and the largest source of tax revenues still remains Value Added Tax (VAT) (45.5%). For the period of January-July 2015, the largest share of total expenditure (35.1%) was devoted to social benefits.
|
||
|
Source: Ministry of Finance of Georgia
|
Source: Ministry of Finance of Georgia
|
|
|
In January-July 2015, compared to the corresponding period in 2014, state budget revenues increased by 13.3% (542.5 mln GEL) and amounted 4 613.3 mln GEL. In this period, 58.0% of the annual plan was complied with, which means that 42.0% of the planned budget remains to be complied with during the remaining five months of the year (August-December), which seems feasible. In January-July 2015, compared to the corresponding period in the previous year, state budget expenditures increased by 11.6% (469.6 mln GEL) and amounted to 4 517.0 mln GEL. During these seven months, 56.3% of the planned annual expenditures was realized. Hence, 43.7% of the planned expenditures still needed to be met in the remaining five months of the year, which seems feasible. In this period, state budget revenues exceed expenditures by 2.1% (96.3 mln GEL).
|
||
|
Source: Ministry of Finance of Georgia
|
Source: Ministry of Finance of Georgia
|
|
|
|
|
|
|
In January-July 2015, state budget revenues increased by 12.0% (461.9 mln GEL) compared to the corresponding period in 2014 and recorded 4 323.3 mln GEL. The structure of the tax revenues remained the same. The largest source of the tax revenues is still VAT (45.5%), then income tax (26.0%), followed by profit tax (16.1%), excise tax (11.2%) and import tax (1.0%). In this period, the revenues increased from VAT (6.6%), income (15.1%), profit (31.0%) and excise (10.5%) taxes, while the revenue declined from import tax (-28.3%). The latter is due to decline of the volume of import (-10.6%) in the corresponding period.
The compliance rate of planned revenues from each tax category is as follows: VAT – 55.9%, income tax – 57.5%, profit – 73.0%, excise – 53.7% and import – 60.3%. Among them, the compliance indicator of profit tax (by 14.9 % points), import tax (3.1) and income tax (2.5) exceeds the previous year, while excise tax (-5.5 % points) and VAT (-0.3 % points) is lower compared to the corresponding indicators in 2014.
|
||
|
Source: Ministry of Finance of Georgia
|
In the period of January-July 2015, 2.9% of state budget revenues (133.2 mln GEL) came from grants. This indicator increased by 73.9% (56.6 mln GEL) compared to the corresponding period in 2014.
In this period, the compliance rate of the grant revenues is 52.0%, which means that 122.7 mln GEL equivalent foreign currencies will flow into Georgia during the remaining five months of the year (August-December), which is supposed to have a positive impact on the stability of the national currency.
|
|
|
|
||
|
Source: Ministry of Finance of Georgia
|
Source: Ministry of Finance of Georgia
|
|
|
In January-July 2015, the structure of state budget expenditures remained the same: social benefits – 35.1%; compensation of employees – 17.3%; grants – 14.7%; other expenditures – 14.4%; goods and services – 11.1%; interest – 4.2%; and subsidies – 3.1%.
Compared to the corresponding period in the previous year, volume of expenditures increased in all categories including social benefits (9.5%), compensation of employees (6.5%), grants (23.3%), other expenditures (14.7%), goods and services (5.5%), interest (34.7%) and subsidies (0.1%).
In this period, the compliance rate of the annual planned expenditure on each category is as follows: social benefits – 59.0%, compensation of employees – 56.7%, grants – 53.0%, other expenditures – 57.3%, goods and services – 53.5%, interest – 50.5% and subsidies – 58.4%. The compliance indicators of all categories of budget expenditure increased, except for goods and services (-2.4 % points) compared to the corresponding period in 2014.
|
||
|
|
||
 |
||


