Issue 42: External Trade – 2014

|
External Trade – 2014
Issue #42 / 27.03.2015
|
||
|
In 2014, the volume of the registered trade turnover is 11 457 mln. USD. The share of import in total registered turnover is 75% and the share of export is 25%. In 2014, the volume of export decreased (-1.6%) and the volume of import increased (7.1%) compared to 2013.
The indicator of export decreased significantly (-20.5%) in IVQ 2014 compared to IVQ 2013 and continued to decrease (-26.9%) in the period of January – February 2015 compared to the corresponding period in 2014. The volume of the registered import also decreased (-2.2%) in January-February 2015.
|
||
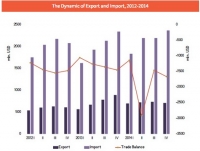
| The Dynamic of Export and Import, 2012-2014 | ||

|
In 2014, the registered external trade turnover increased (4.7%, 523 mln. USD) compared to 2013. The share of import in it increased (1.6% point) and the share of export decreased (-1.6 % point) respectively.
In this period, the trade balance worsened (-12.06%, 617 mln. USD) due to the decrease of the volume of export (-1.6%; 47 mln. USD) and the volume increase of the volume of import (7.1%, 570 mln. USD).
The volume of export started to decrease in the IIIQ 2014 (-6.15%). This indicator decreased significantly (-20.5%) in IVQ 2014 compared to IVQ 2013 and still continues to decrease. In the period of January-February 2015 the volume of export is -26.9% lower compared to the corresponding indicator in 2014. In this period the volume of import also decreased (-2.2%; 25.3 mln. USD). Due to the fact that export declined more than import did, the trade balance also worsened (90.19 mln. USD).
|
|
| Source: National Statistics Office of Georgia | ||
| The Import by Commodity Groups, 2012-2014 | The Export by Commodity Groups, 2012-2014 | |
|
Source: National Statistics Office of Georgia
|
Source: National Statistics Office of Georgia
|
|
|
In 2014, the top five imported commodities in Georgia are petroleum (10.7%), motor cars (8.3%), gases (4.3%), medicaments (3.7%) and electric apparatus (2.27%). The petroleum is mainly imported from Romania, Azerbaijan, Bulgaria, Greece and Turkmenistan; the motor cars – from Japan, USA, Germany, Korea and UK; the gases – from Azerbaijan and Russia; the medicaments – from Turkey, Germany, Hungary, France, Austria and Bulgaria; the electric apparatus – from Emirates, China, Vietnam, Netherlands and USA.
In 2014, the import of electric apparatus (28.9%), gases (16.5%), medicaments (12.07%) and motor cars (0.64%) increased compared to 2013.
The growth of import of electric apparatus and gases is due to the increase of volume, as well as the increase of prices of these products and the growth of import of motor cars and medicaments is due to the increase of only the volume of these products, as their prices declined.
In this period, the indicator of the Import of petroleum decreased (-3.78%), due to the fact that its price decreased (the volume increased).
|
In 2014, the top five exported commodities from Georgia were: motor cars (18.1%), ferroalloys (10%), copper ores (8.7%), nuts (6.4%) and wine (6.3%). The motor cars are exported mainly to Azerbaijan, Armenia and Belgium; the ferroalloys – to USA, Ukraine and Russia; the copper ores – to Bulgaria, China, Spain and Singapore; the nuts – to Italy, Germany, Kazakhstan, Spain and Slovakia; the wine – to Russia, Ukraine, Kazakhstan, Belarus and China.
In 2014, the export of cooper ores (53.5%), wine (41.4%), ferroalloys (24.3%) and nuts (10%) increased compared to 2013. The growth of exports of wine and ferroalloys is due to the increase of volume of export, as well as the increase of prices of these commodities. The extended export of copper ores is due to the increase of its volume (its price decreased) and of nuts is due to increase of its price (its volume decreased).
In this period, the export of motor cars significantly declined, mainly due to the restriction of import of used motor cars in Azerbaijan. In April 2014, Azerbaijan adopted the Euro-4 environmental standard, which restricts the import of cars manufactured in EU before 2005, in USA before 2004 and in Japan before 2011.
|
|
| The Top Five Partner Countries by Import, 2012-2014 | The Top Five Partner Countries by Export, 2012-2014 | |
 |
 |
|
| Source: National Statistics Office of Georgia | Source: National Statistics Office of Georgia | |
|
In 2014, the top five partner countries by import were Turkey (20.09%), China (9.1%), Azerbaijan (7.3%), Russia (6.4%) and Ukraine (6.0%). In this period, the import from Turkey (22.6%) and China (19.87%) increased and the import from Ukraine (-9.38%), Azerbaijan (-2.35%) and Russia (-1.71%) declined compared to 2013.
The main commodities imported from Turkey are medicaments, turbines, structures made from iron or steel and their parts, tubes, cables, napkin liners for babies, washing and cleaning preparations.
The main commodities imported from China are automatic data processing machines, structures made from iron, telephone sets, refrigerators and refrigerating equipment, furniture, washing machines and new pneumatic tyres of rubber.
The main commodities imported from Azerbaijan are petroleum and petroleum gases, gypsum, electricity, margarine, tea and seed oil.
The main commodities imported from Russia are wheat and muslin, petroleum gases, petroleum, electricity, chocolate, seed oil and medicaments.
The main commodities imported from Ukraine are cigars, cigarillos and cigarettes, bars and rods of iron or non-alloy steel, coke, chocolate, seed oil, meat of the poultry, bread, pastry and cakes.
|
In 2014, the top five partner countries by export were Azerbaijan (18.5%), Russia (10.6%), Armenia (9.3%), Turkey (8.3%), and also USA (6.1%). In this period, the export to Russia (44.18%), Turkey (30.87%) and USA (52.16%) increased and the export to Azerbaijan (-23.31%) and Armenia (-8.61%) declined compared to 2013.
The declined export to Azerbaijan is due to the decrease of the exports of motor cars and trucks, live bovine animals, cement, live sheep and goats. Besides, medicaments, mineral and aerated waters and rods of iron or non-alloy steel are also exported to Azerbaijan.
The declined exports to Armenia is due to the decrease of exports of wheat, cereals and corn. Besides, motor cars and trucks, fertilizers, oil-cake and other solid residues and electricity are also exported to Armenia.
The commodities exported to Russia are wine, mineral waters, spirituous beverages, ferroalloys, citrus fruit, motor cars and electrical energy.
The main commodities exported to Turkey are fertilizers, semi-finished products, electricity, ferroalloys, motor cars, rods of iron or non-alloy steel, women’s suits and blouses.
The main commodities exported to USA are ferroalloys, fertilizers, turbines and transmission apparatus.
|
|
|
|
||
 |
||


